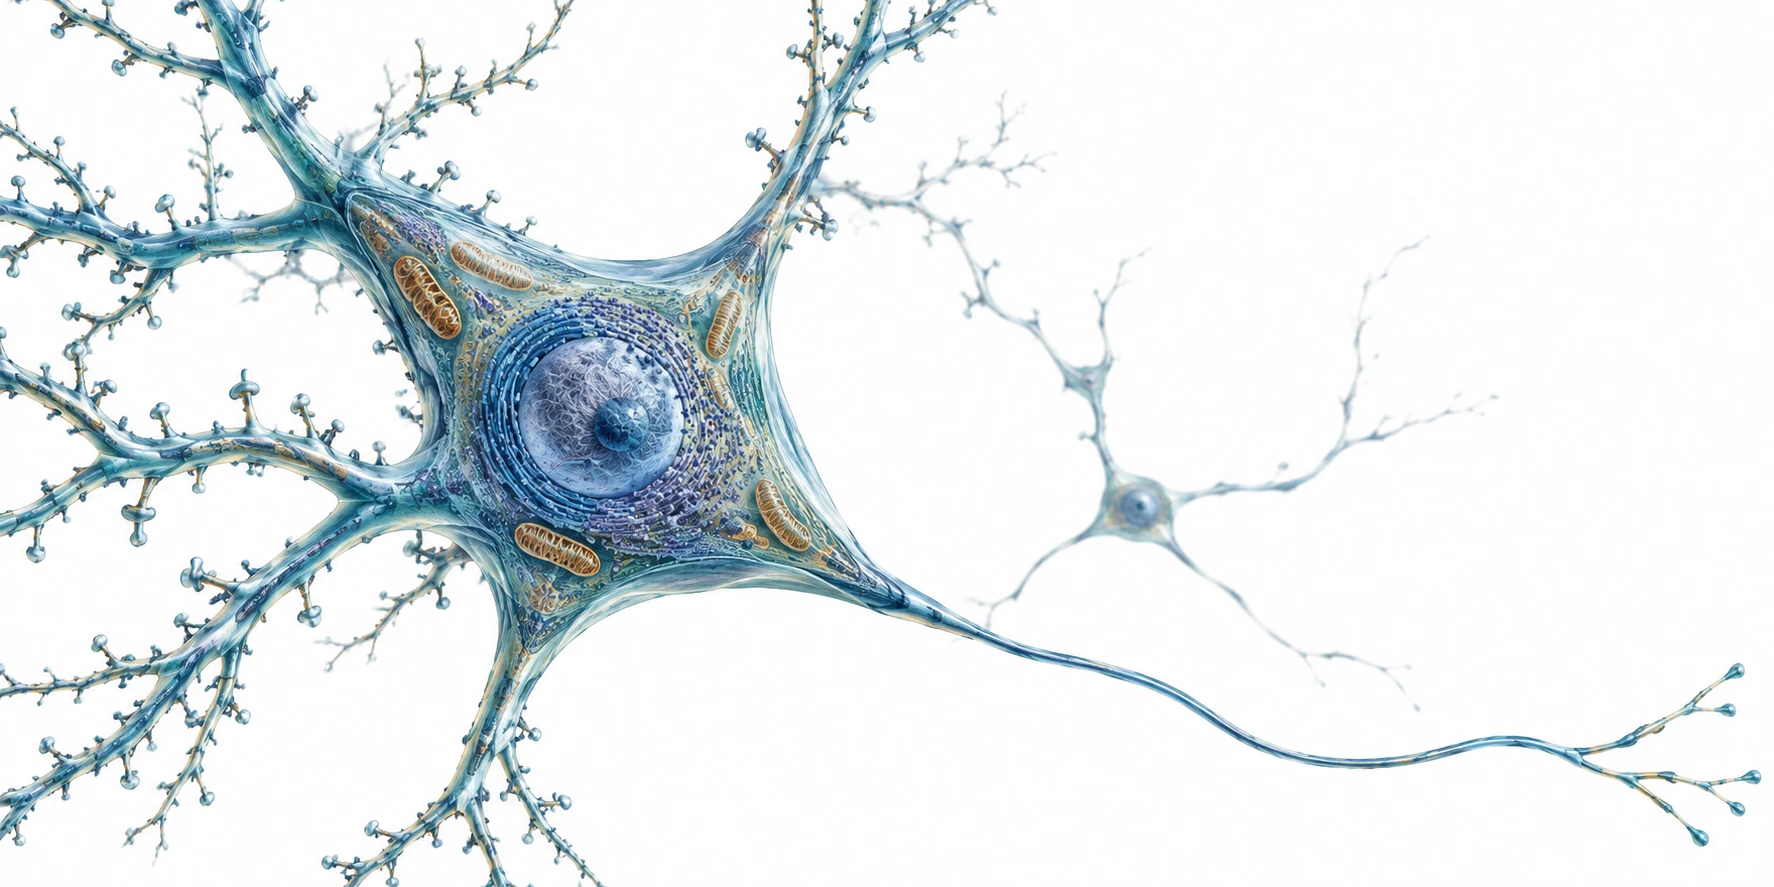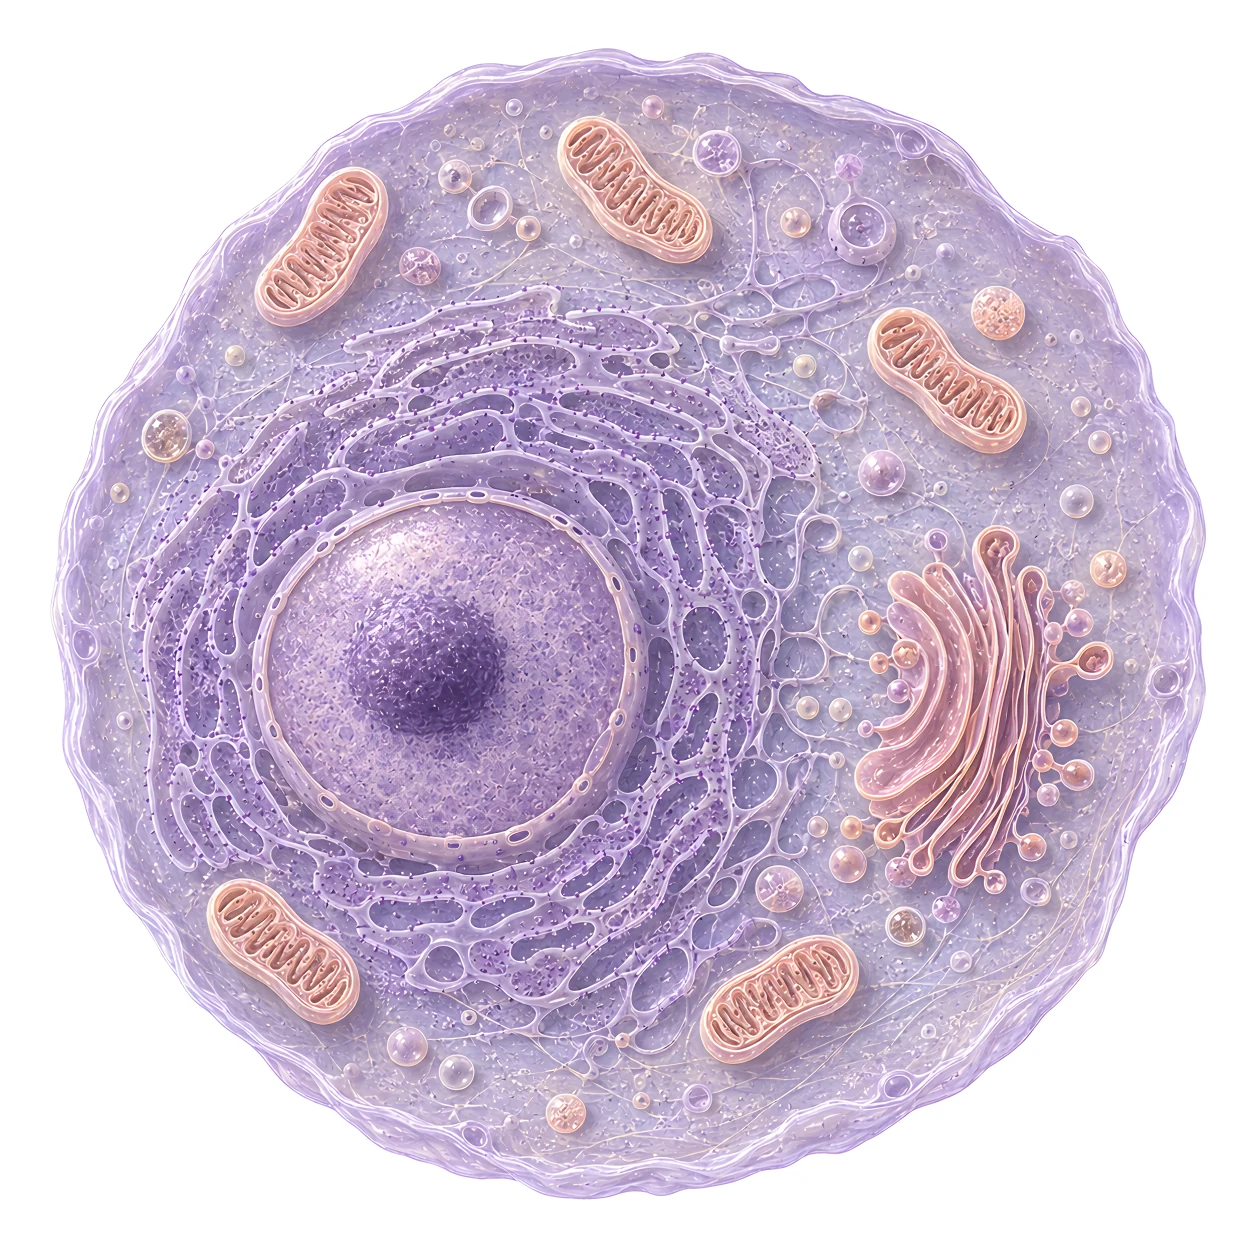
We train causal disease models.

    Our models capture how diseases develop and help find the right targets for new drugs. We work with pharmaceutical and biotech companies to identify promising targets, find new indications and understand which patients are most likely to benefit.

    We found disease-driving genes 13.7x more often than chance.

    A causal disease model connects molecular activity, cellular mechanisms and disease outcomes. A travelling signal follows established cholesterol biology, including HMGCR, the statin target, and secreted PCSK9. The surrounding network and response envelopes are illustrative, not fitted predictions.

    Find the targets that drive disease.

    See what drugging a target could do before committing years to a program.

    HMGCRSTATIN TARGETCellular cholesterolActive SREBP-2LDL receptorSecreted PCSK9Circulating ApoBLDL clearanceLipid retentionFoam-cell statePlaque burdenLipid burdenPlaque stabilityInflammationHMGCRSTATIN TARGETCellular cholesterolActive SREBP-2LDL receptorSecreted PCSK9Circulating ApoBLDL clearanceInflammationPlaque stabilityLipidsHMGCRSTATIN TARGETCellular cholesterolActive SREBP-2LDL receptorSecreted PCSK9Circulating ApoBLDL clearanceLipid retentionFoam-cell statePlaque burdenLipid burdenPlaque stabilityInflammationHMGCRSTATIN TARGETCellular cholesterolActive SREBP-2LDL receptorSecreted PCSK9Circulating ApoBLDL clearanceInflammationPlaque stabilityLipids

    We use multi-modal data to understand disease dynamics.

    Our models draw on millions of measurements per disease, including single-cell data, genetic perturbations, human genetics and clinical study results. We surface targets the literature is quiet on and investigate new indications for existing assets.

    Causal disease model
    YOUR DATACLINICAL TRIALSHUMAN GENETICSDRUG RESPONSESGENETIC PERTURBATIONSGENE REGULATIONTISSUE ARCHITECTURECELL STATES
    • CELL STATES. Our disease models draw on single-cell profiles from patient tissue. We reanalyze the underlying measurements to characterize changes in gene activity across the cell populations involved.
    • TISSUE ARCHITECTURE. Spatial transcriptomics adds the tissue context: where molecular changes occur and which cellular environments surround them. This evidence helps locate disease processes and assess where a target could act.
    • GENE REGULATION. We investigate the regulatory programs associated with disease using chromatin and gene-expression data. These analyses contribute evidence about potential points of intervention and their wider effects on cell behavior.
    • GENETIC PERTURBATIONS. Perturb-seq and CRISPR screens put molecular relationships to an experimental test. The models draw on measured responses to gene disruption to investigate which targets influence disease mechanisms.
    • DRUG RESPONSES. What a treatment changes is evidence in its own right. We analyze molecular and functional measurements from compound and biologic experiments to investigate the consequences of target modulation.
    • HUMAN GENETICS. Large human genetic studies provide evidence about targets in people. Associations with gene activity, protein levels and disease risk help assess the potential consequences of an intervention.
    • CLINICAL TRIALS. Measured treatment effects connect the models to outcomes in patients. Our analysis of clinical study results helps assess the evidence for a target, including findings that challenge it.
    • YOUR DATA. Bring your screens, cohorts or experimental results. We use that evidence to investigate questions specific to your program, from the rationale for a target to new indications for an existing asset.

    Diseases share mechanisms.

    Our models do too. We trace shared mechanisms across diseases to find new targets and new indications for existing assets.

    IPFLungadenocarcinomaEndometriosisSystemicsclerosisPsoriasisIBDAtherosclerosisObesityMASHHFpEFCKDParkinson's

    All connections

    IPFLUNGADENOCARCINOMAENDOMETRIOSISSYSTEMICSCLEROSISPSORIASISIBDATHEROSCLEROSISOBESITYMASHHFpEFCKDPARKINSON'SMATRIXREMODELINGTGF-β / SMADMACROPHAGESTATEINFLAMMASOMENF-κB REGULONMETABOLIC STRESSSENESCENT CELLSANGIOGENESISEPITHELIALREPAIRAUTOPHAGY

    Audit your targets and find novel ones.

    Audit a target

    Examine the evidence behind a target before committing to a program or licensing an asset.

    Find new targets

    Identify intervention points in the mechanisms driving disease.

    Find another indication

    Follow shared mechanisms into diseases where an existing asset could have a role.

    Identify likely responders

    Investigate which patient populations are most likely to benefit—and the biomarkers that could distinguish them.

    We build models for any disease and benchmark them against the best published results.

    We test whether the models predict which pairs of gene disruptions a cancer cell cannot survive. With both genes held out of training, the models score 0.86 AUROC.

    How do we know the models are causal?

    Both genes unseen in training.

    Theorema-SL
    0.86
    SLMGAEStrongest published comparator shown
    0.79
    Scores and comparison details

    Generalization to unseen genes

    Mean AUROC across three gene-overlap settings. Theorema-SL scores 0.95, 0.91 and 0.86; SLMGAE scores 0.93, 0.85 and 0.79. Eleven other published methods appear in pale purple.1.000.750.500.25NSF4SL: Mostly seen genes 0.9319; One unseen gene 0.7703; Both genes unseen 0.6834GCATSL: Mostly seen genes 0.9429; One unseen gene 0.8386; Both genes unseen 0.6783GRSMF: Mostly seen genes 0.9060; One unseen gene 0.8030; Both genes unseen 0.6558PiLSL: Mostly seen genes 0.9269; One unseen gene 0.7888; Both genes unseen 0.6259KG4SL: Mostly seen genes 0.9410; One unseen gene 0.8062; Both genes unseen 0.5625SLGNN: Mostly seen genes 0.9244; One unseen gene 0.7345; Both genes unseen 0.5304MGE4SL: Mostly seen genes 0.7048; One unseen gene 0.5805; Both genes unseen 0.5297PTGNN: Mostly seen genes 0.9255; One unseen gene 0.7898; Both genes unseen 0.5287CMFW: Mostly seen genes 0.7817; One unseen gene 0.5930; Both genes unseen 0.4913DDGCN: Mostly seen genes 0.8528; One unseen gene 0.7830; Both genes unseen 0.4852SL2MF: Mostly seen genes 0.7812; One unseen gene 0.3027; Both genes unseen 0.3764Theorema-SL: Mostly seen genes 0.9508; One unseen gene 0.9138; Both genes unseen 0.86090.86SLMGAE: Mostly seen genes 0.9344; One unseen gene 0.8535; Both genes unseen 0.79010.79ChanceMostly seengenesOne unseengeneBoth unseengenes
    Theorema-SLSLMGAE · published11 other published methods
    • Theorema-SL: Mostly seen genes 0.9508; One unseen gene 0.9138; Both genes unseen 0.8609.
    • SLMGAE: Mostly seen genes 0.9344; One unseen gene 0.8535; Both genes unseen 0.7901.
    • NSF4SL: Mostly seen genes 0.9319; One unseen gene 0.7703; Both genes unseen 0.6834.
    • GCATSL: Mostly seen genes 0.9429; One unseen gene 0.8386; Both genes unseen 0.6783.
    • GRSMF: Mostly seen genes 0.9060; One unseen gene 0.8030; Both genes unseen 0.6558.
    • PiLSL: Mostly seen genes 0.9269; One unseen gene 0.7888; Both genes unseen 0.6259.
    • KG4SL: Mostly seen genes 0.9410; One unseen gene 0.8062; Both genes unseen 0.5625.
    • SLGNN: Mostly seen genes 0.9244; One unseen gene 0.7345; Both genes unseen 0.5304.
    • MGE4SL: Mostly seen genes 0.7048; One unseen gene 0.5805; Both genes unseen 0.5297.
    • PTGNN: Mostly seen genes 0.9255; One unseen gene 0.7898; Both genes unseen 0.5287.
    • CMFW: Mostly seen genes 0.7817; One unseen gene 0.5930; Both genes unseen 0.4913.
    • DDGCN: Mostly seen genes 0.8528; One unseen gene 0.7830; Both genes unseen 0.4852.
    • SL2MF: Mostly seen genes 0.7812; One unseen gene 0.3027; Both genes unseen 0.3764.
    From the blog · 5 minute read

    What makes a target worth drugging?

    Which biology gets a chance to become a medicine, and why familiar targets keep winning.

    Read the essay

    Let's work on a program you're advancing.

    Bring an asset you're working on, or just talk through where the models de-risk your discovery and diligence.